
Background
Scorpio.Space built a platform for managing the process of QA testing. The task was to create a data-driven dashboard to run, track and analyze automated testing for hardware devices.
Challenge
How to build a product from zero?
I worked directly with the company's CTO to understand the test execution process. Together, we analyzed insights and translated concepts into features. Based on this information, I wrote the use case scenarios.
My main challenges were:
- Translating the testing procedure performed by QA testers into a dashboard that provides clear and actionable insights into the testing results.
- Balancing functionality and usability: the system needs to be functional, allowing users to easily test hardware modules, but it also needs to be user-friendly, providing an intuitive and streamlined experience.
Framework: Agile/ Lean UX
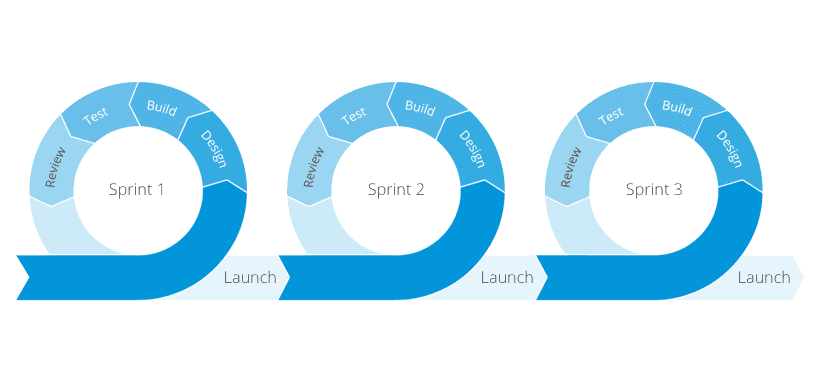
Our team consisted of a product designer (me), and the R&D team (QA engineers, developers). Throughout the project, we followed an iterative and collaborative approach to ensure we met the changing needs of our stakeholders and conducted regular sprint retrospectives to review what went well and identify areas for improvement.
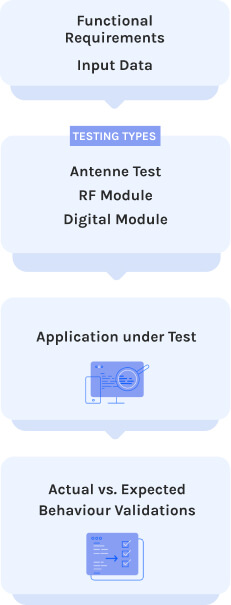
Discovery and Research
Together with the CTO and we defined and mapped our Goals and Use Cases.
1. Competitive Analysis
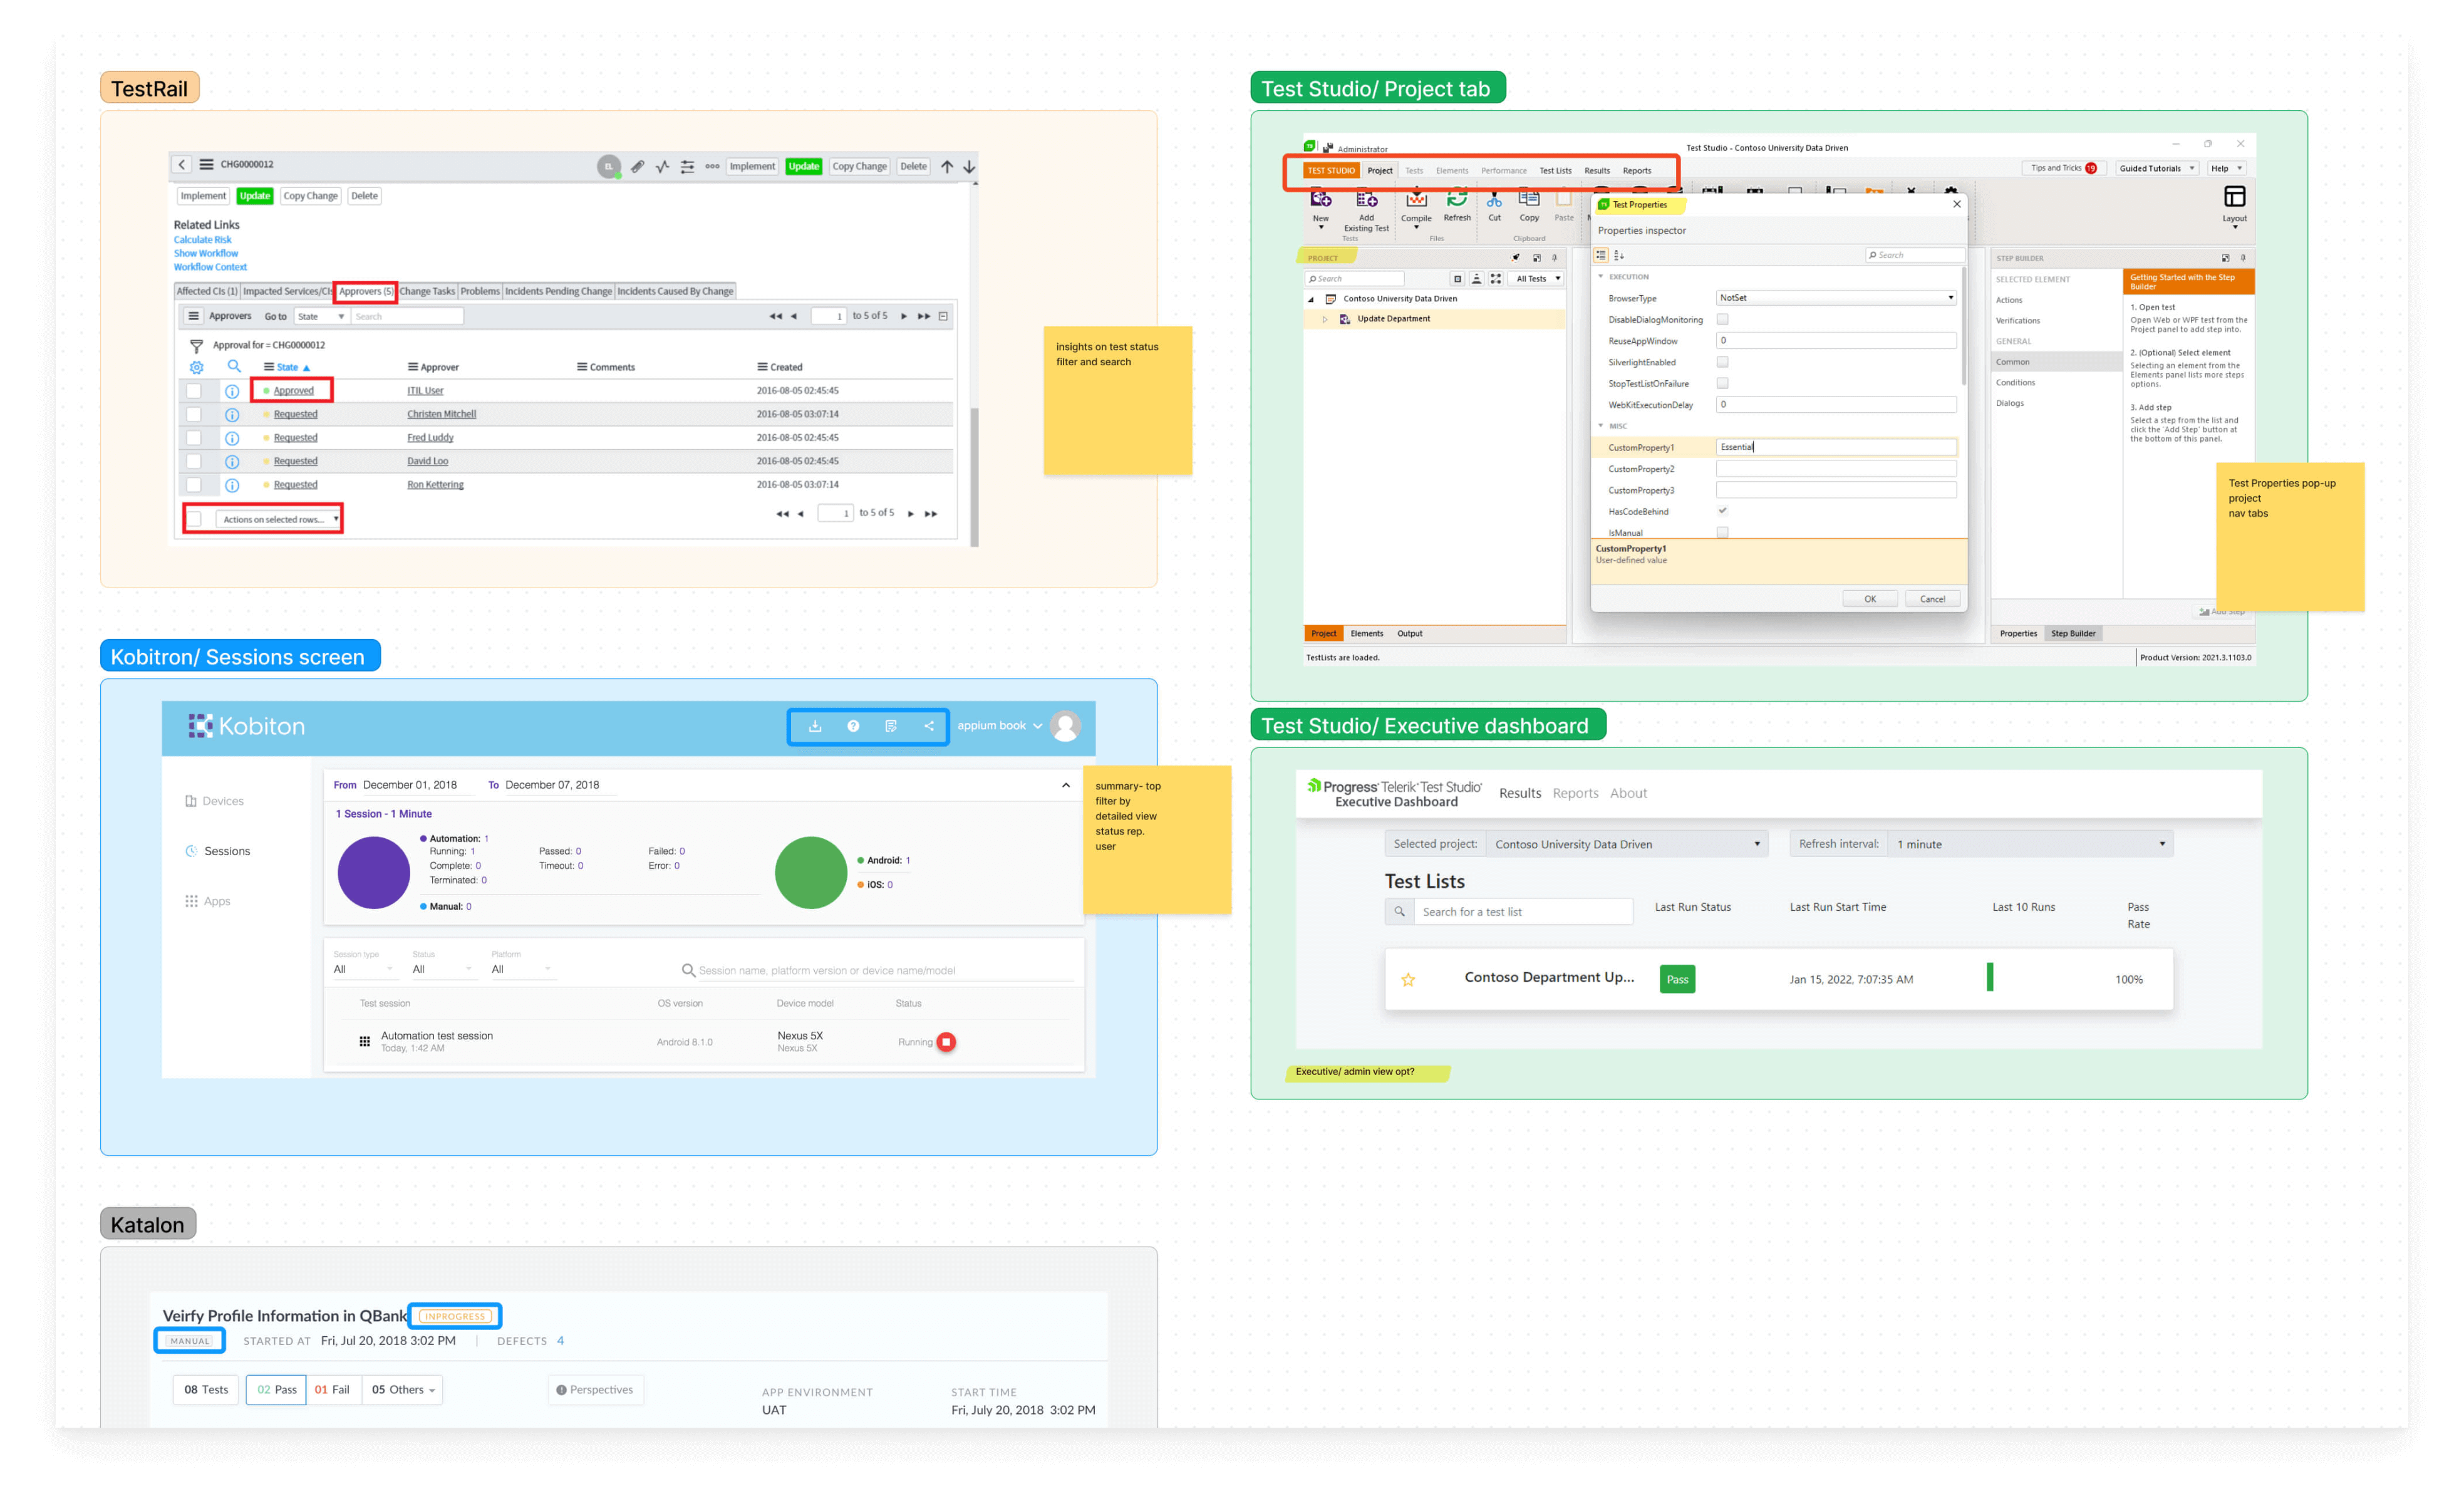
To determine the features I ran a comparative study of 10 test management tools. The research gave me insights into worthy features we could implement. Yet those were only assumptions. To verify them, I had to talk to the system's users.
Tools used:
2. User Interviews
I conducted stakeholder interviews with the R&D team and user interviews with QA testers and engineers.
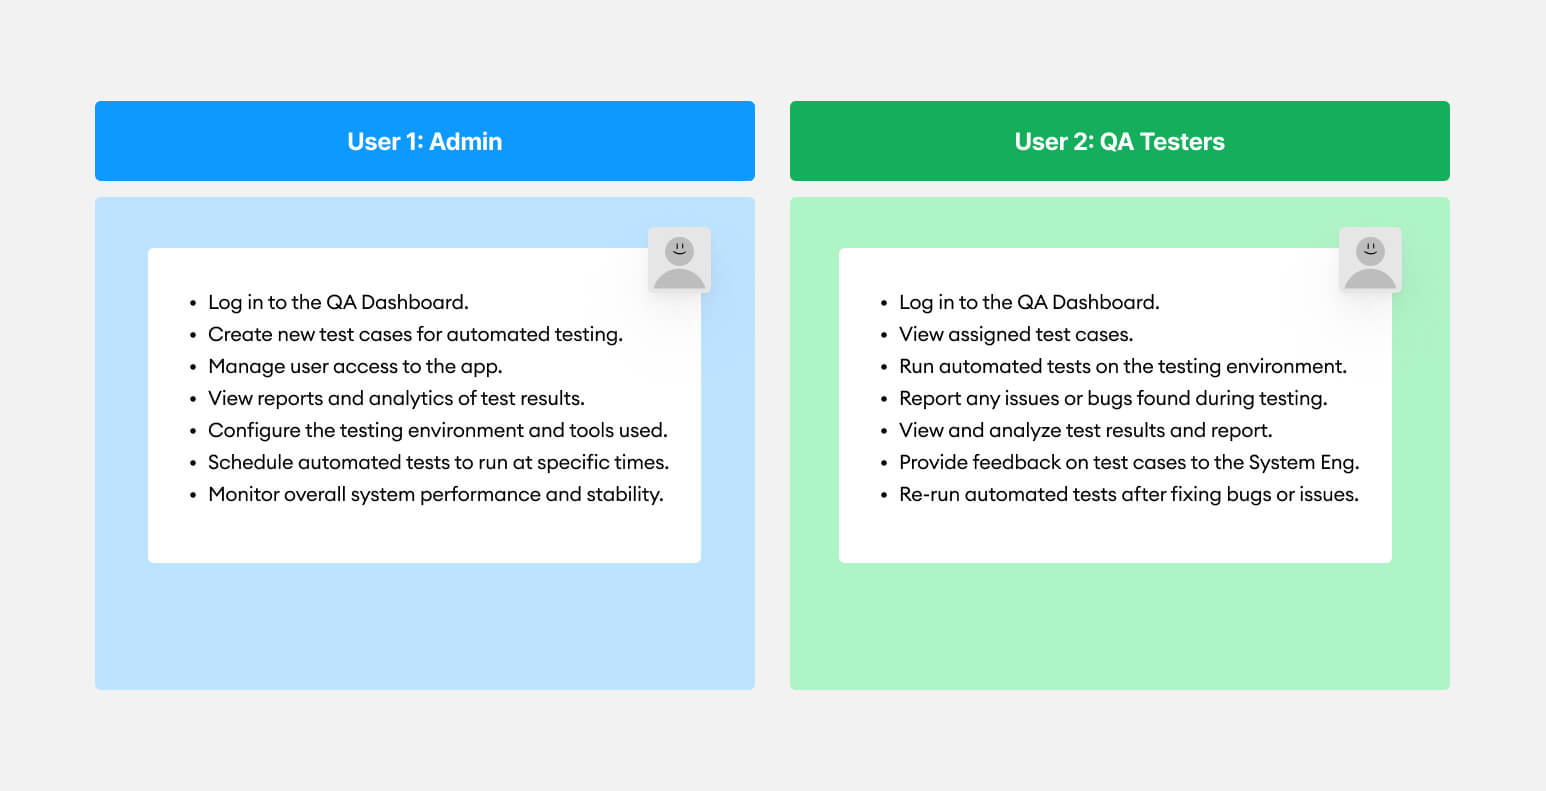
3. Observations
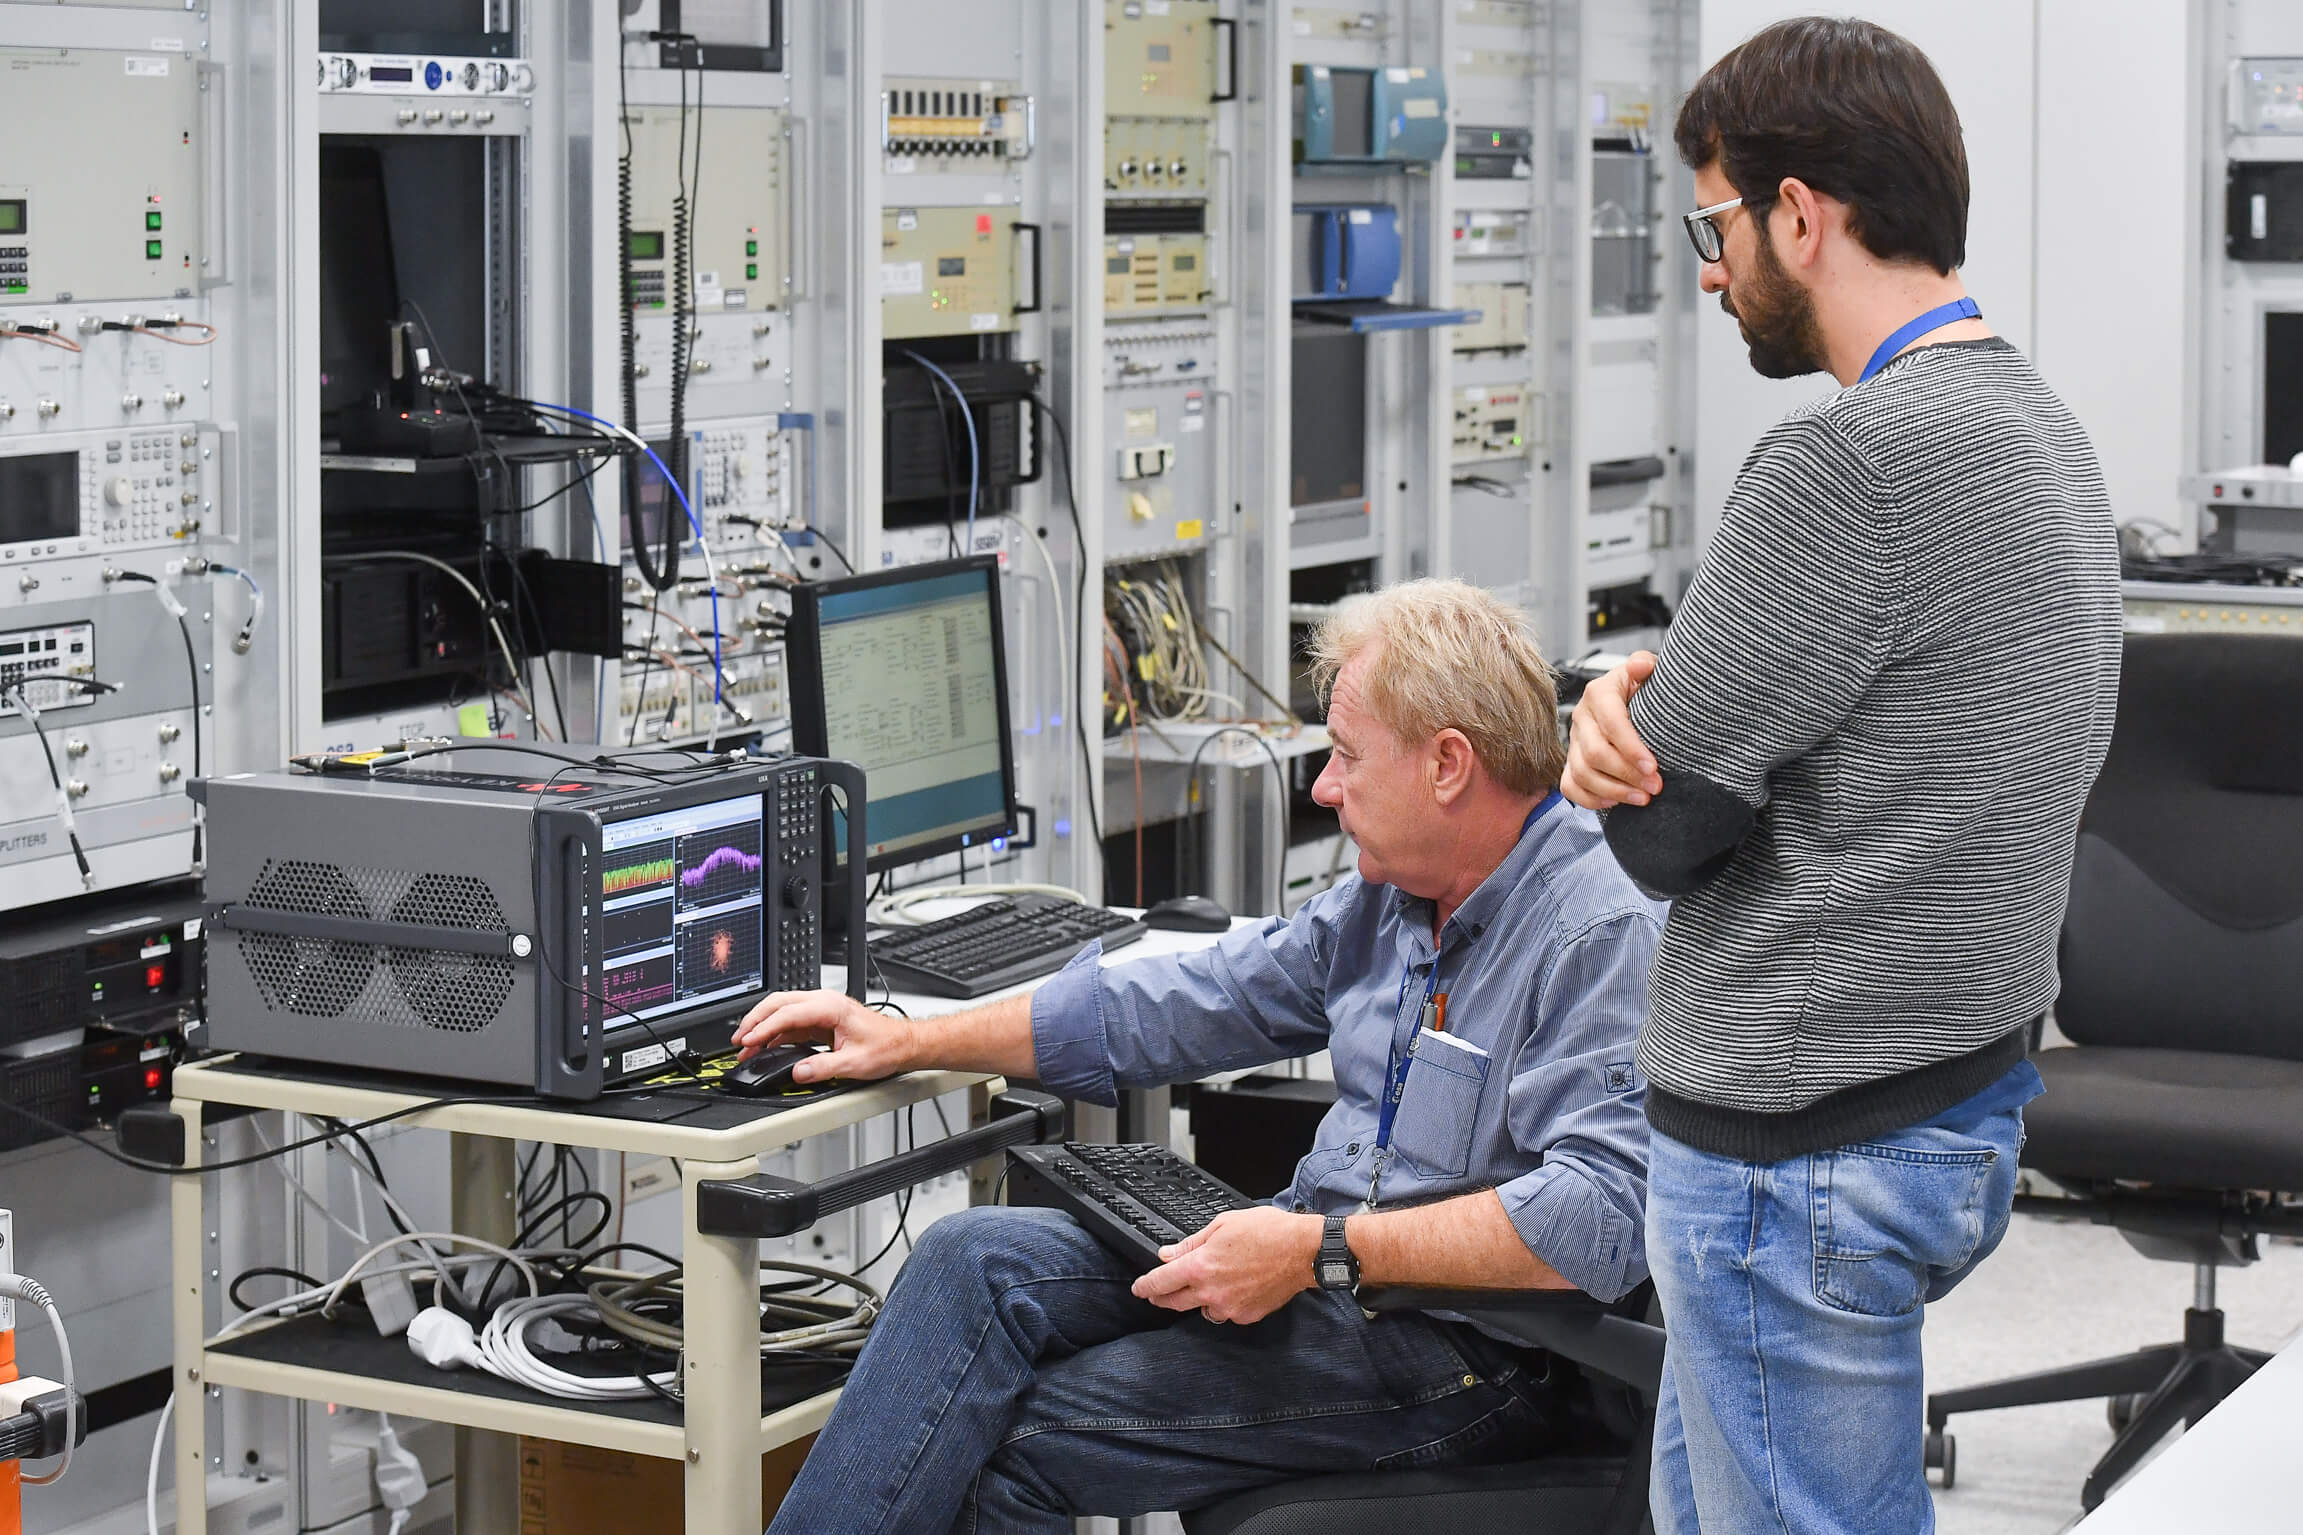
In the observations phase of the research, I analyzed the QA testing process of hardware modules by observing test execution, examining the work environment, and evaluating the impact of the application on the physical testing of the modules
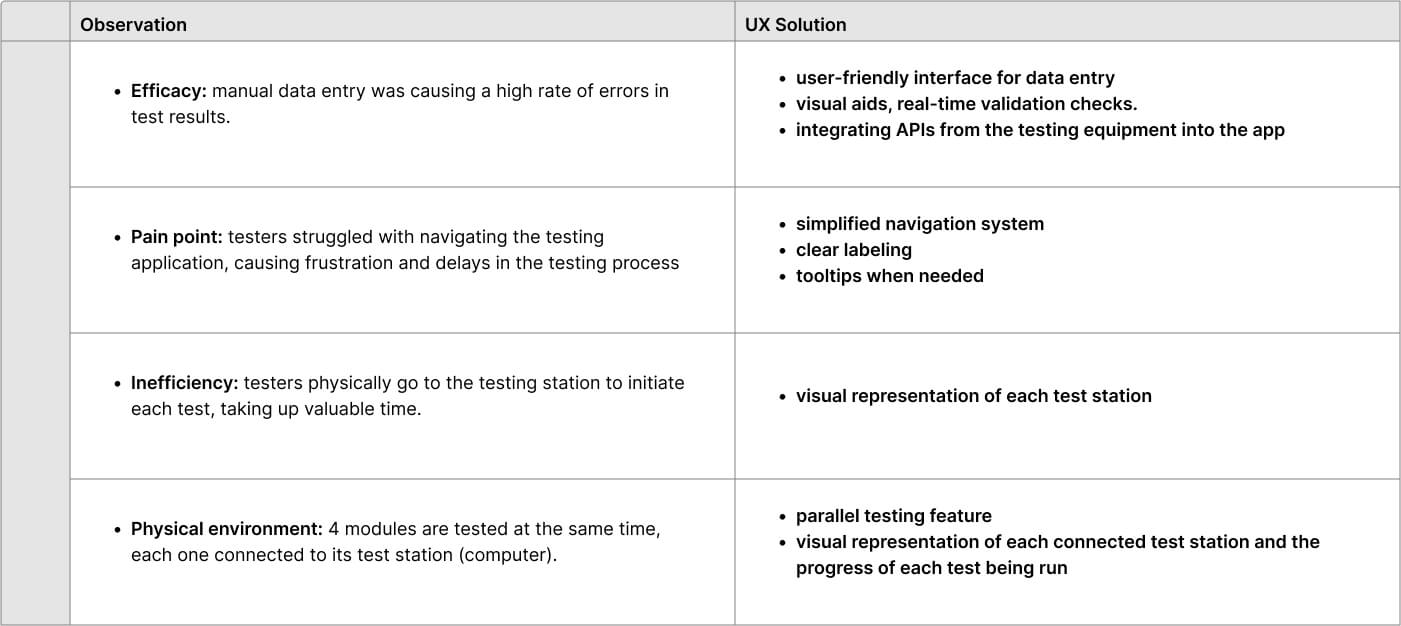
Main insights following the observation:
4. Building a User Flow
Mapping user needs laid the foundation of the system's navigation. A storyboard depicted the key interactions the users would take while using the system.
mapping, storyboard
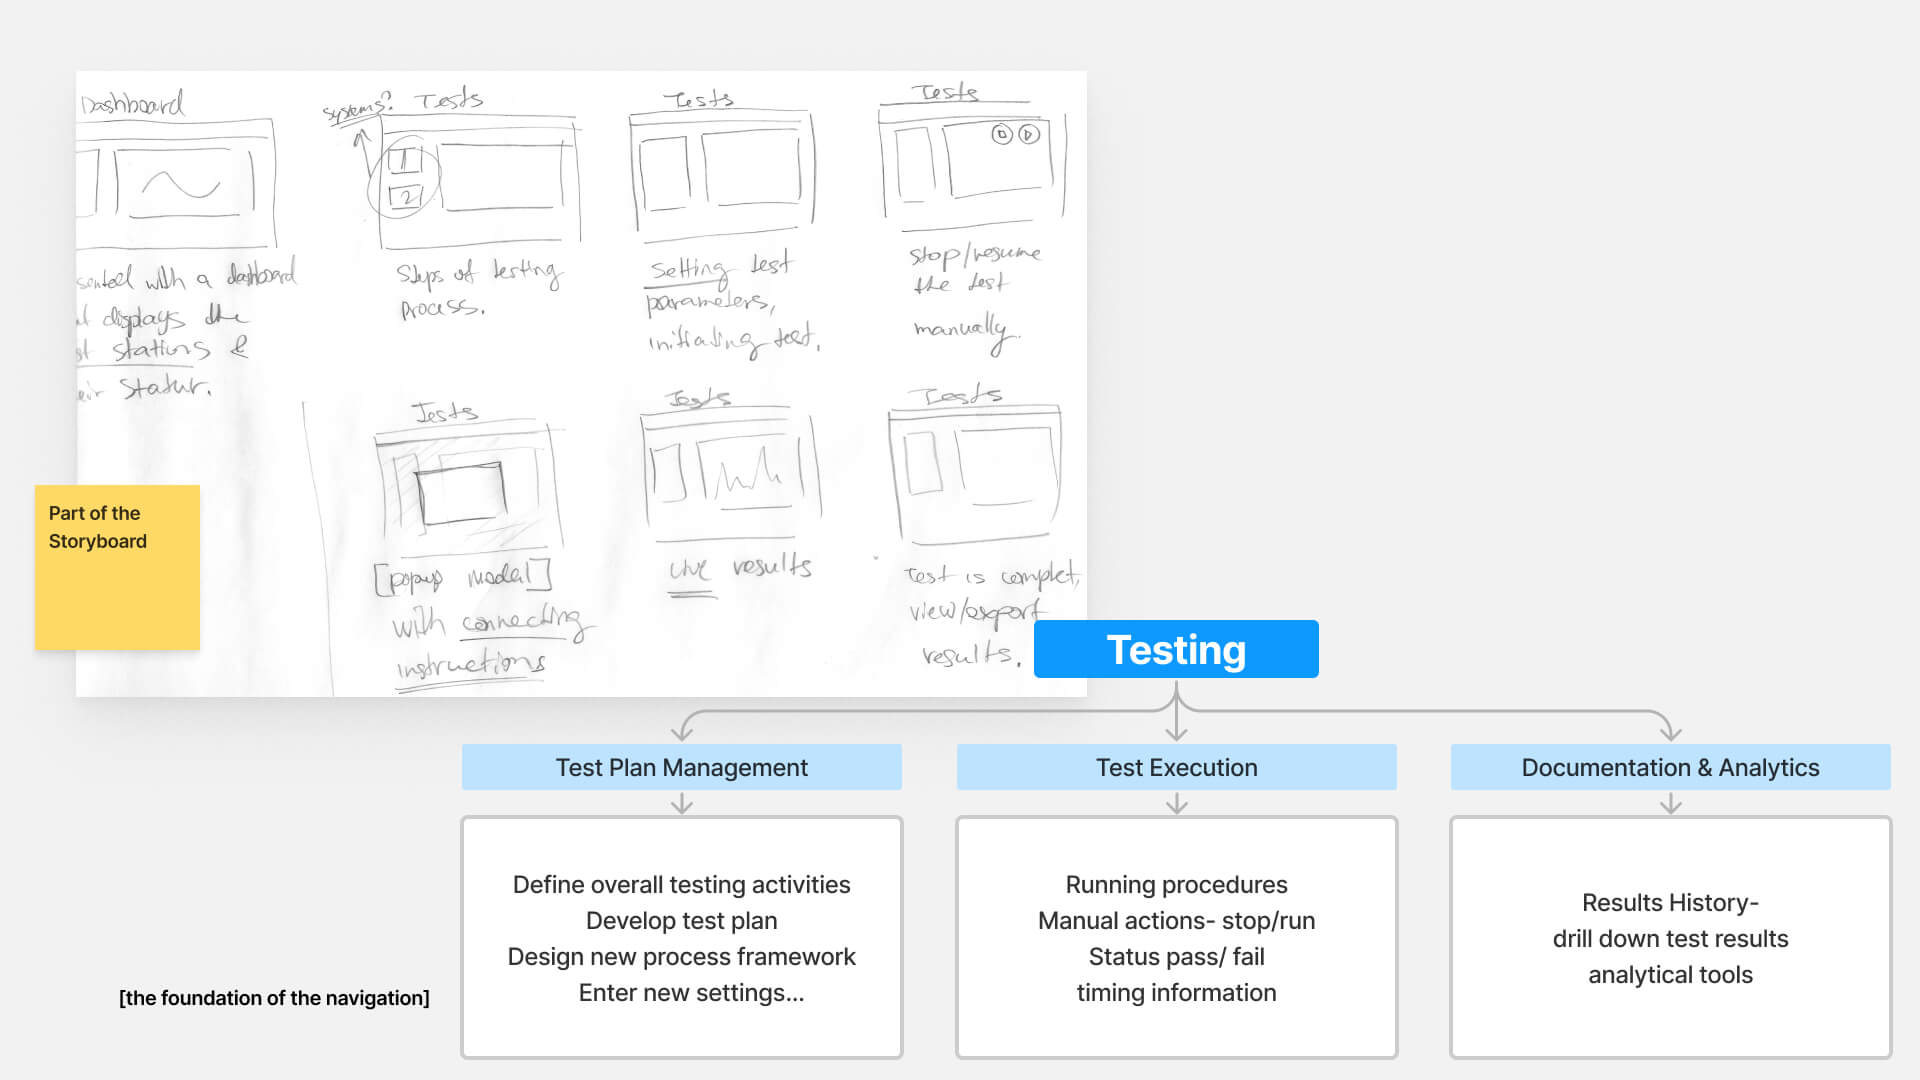
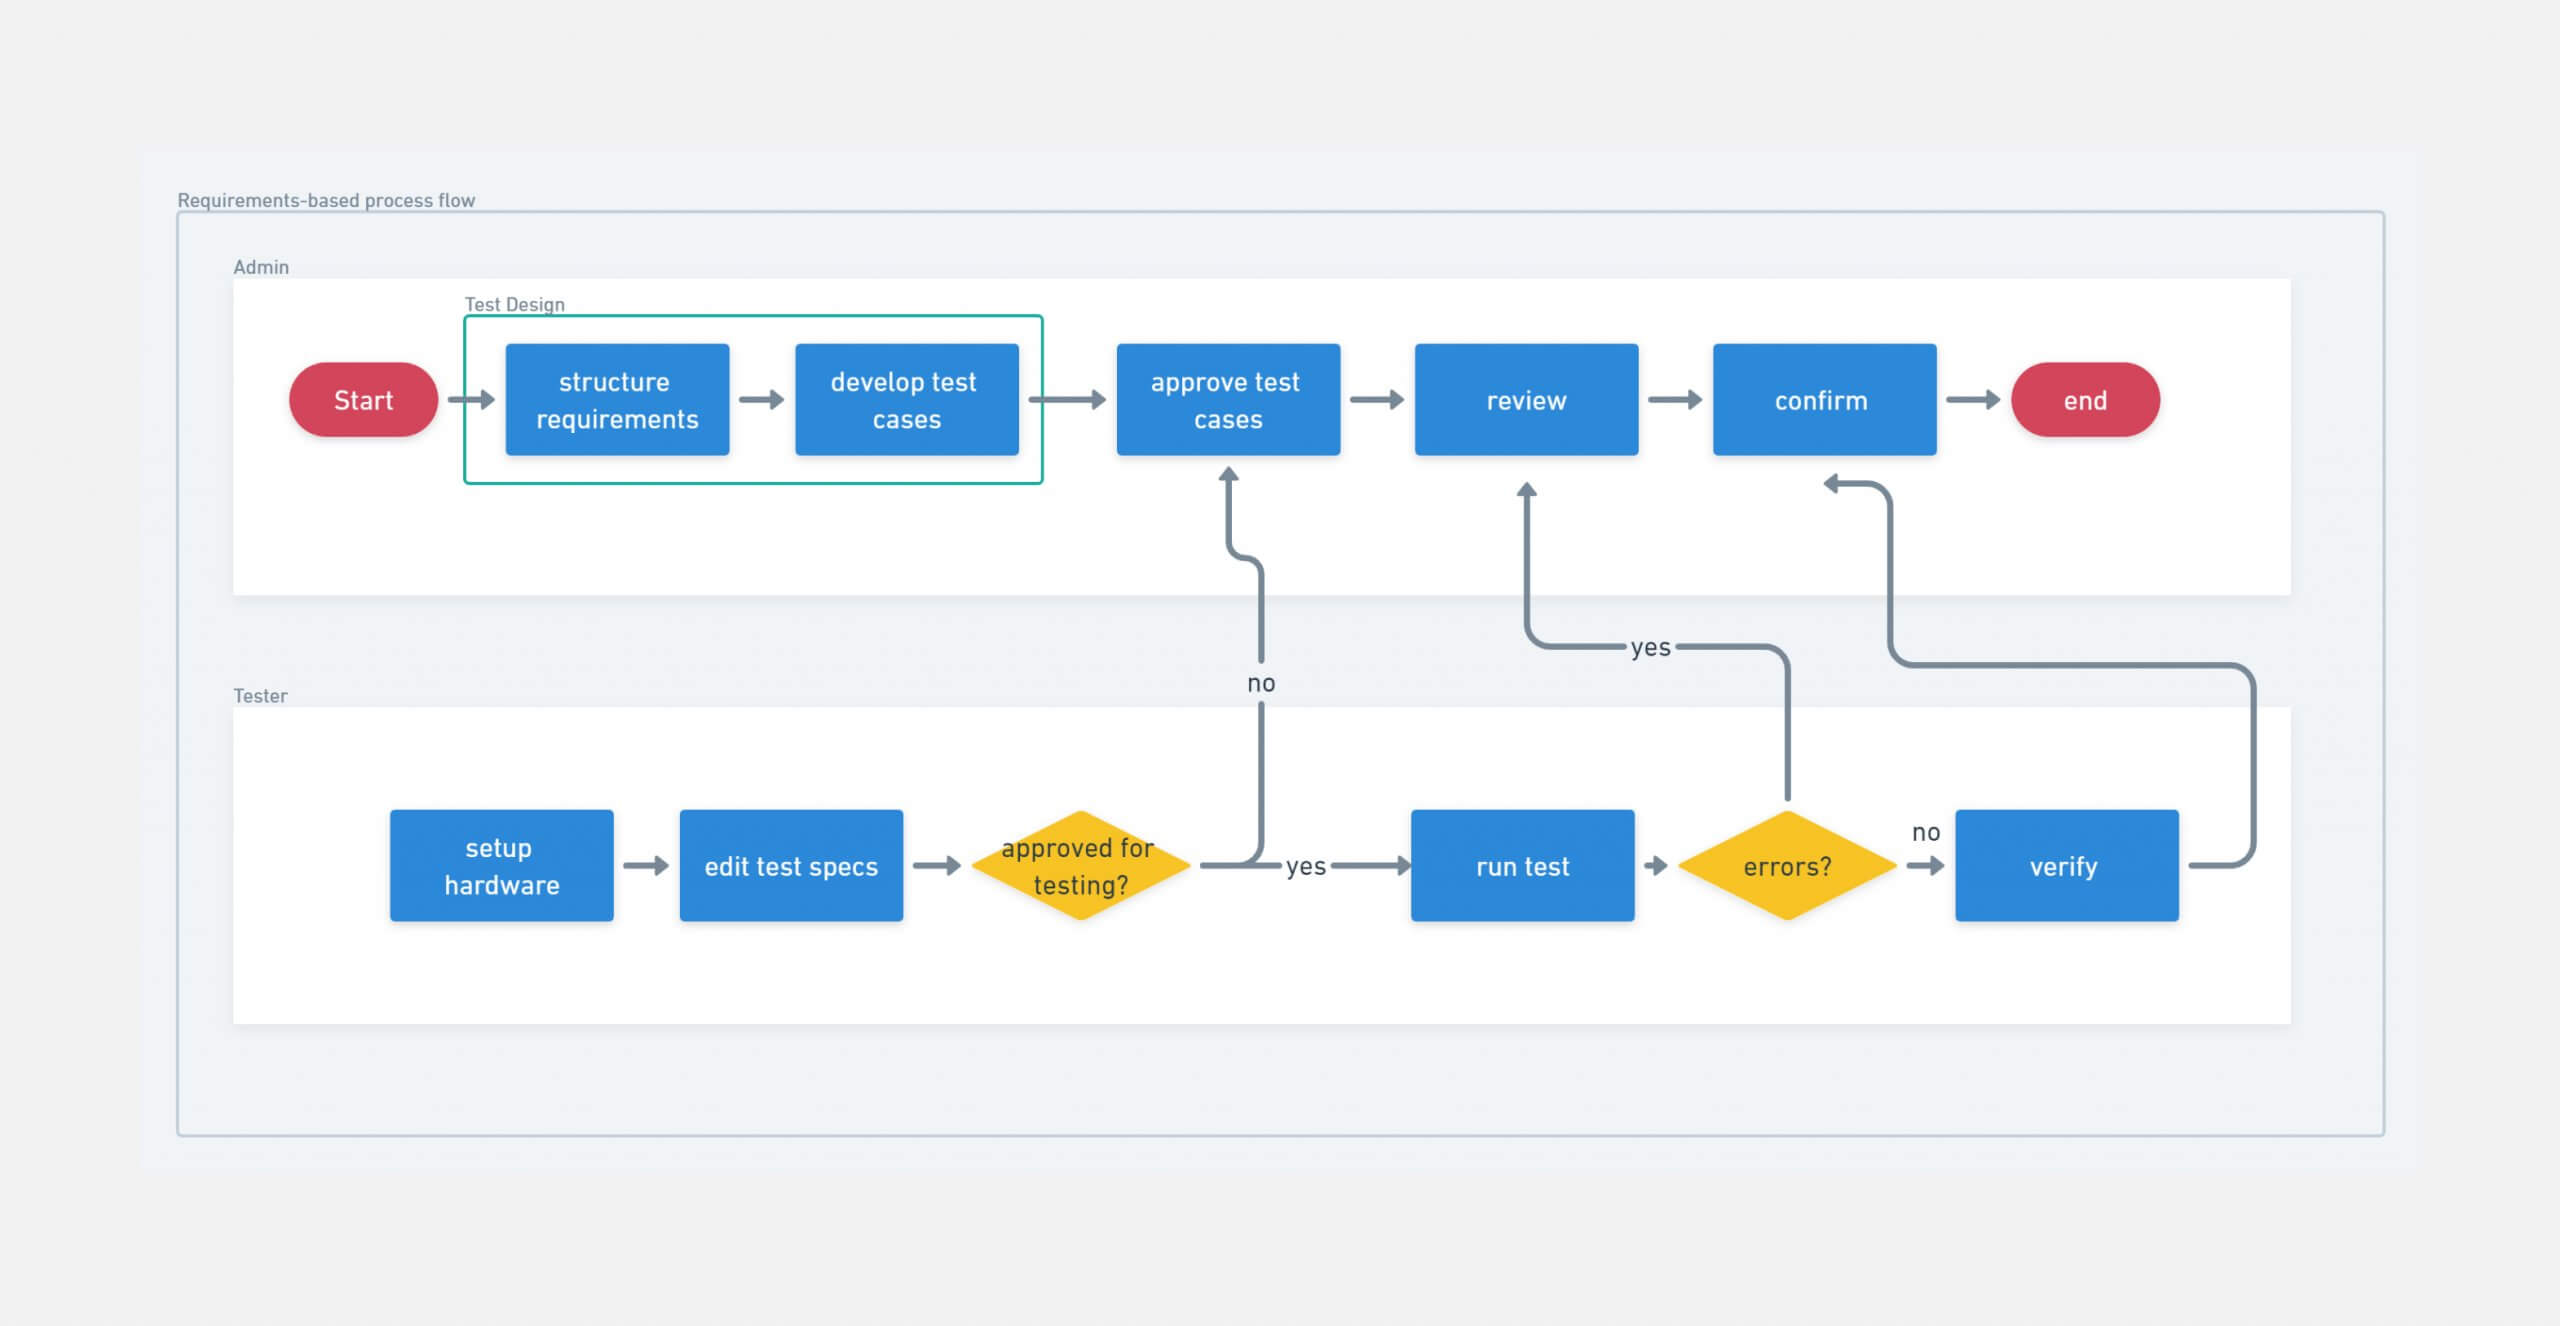
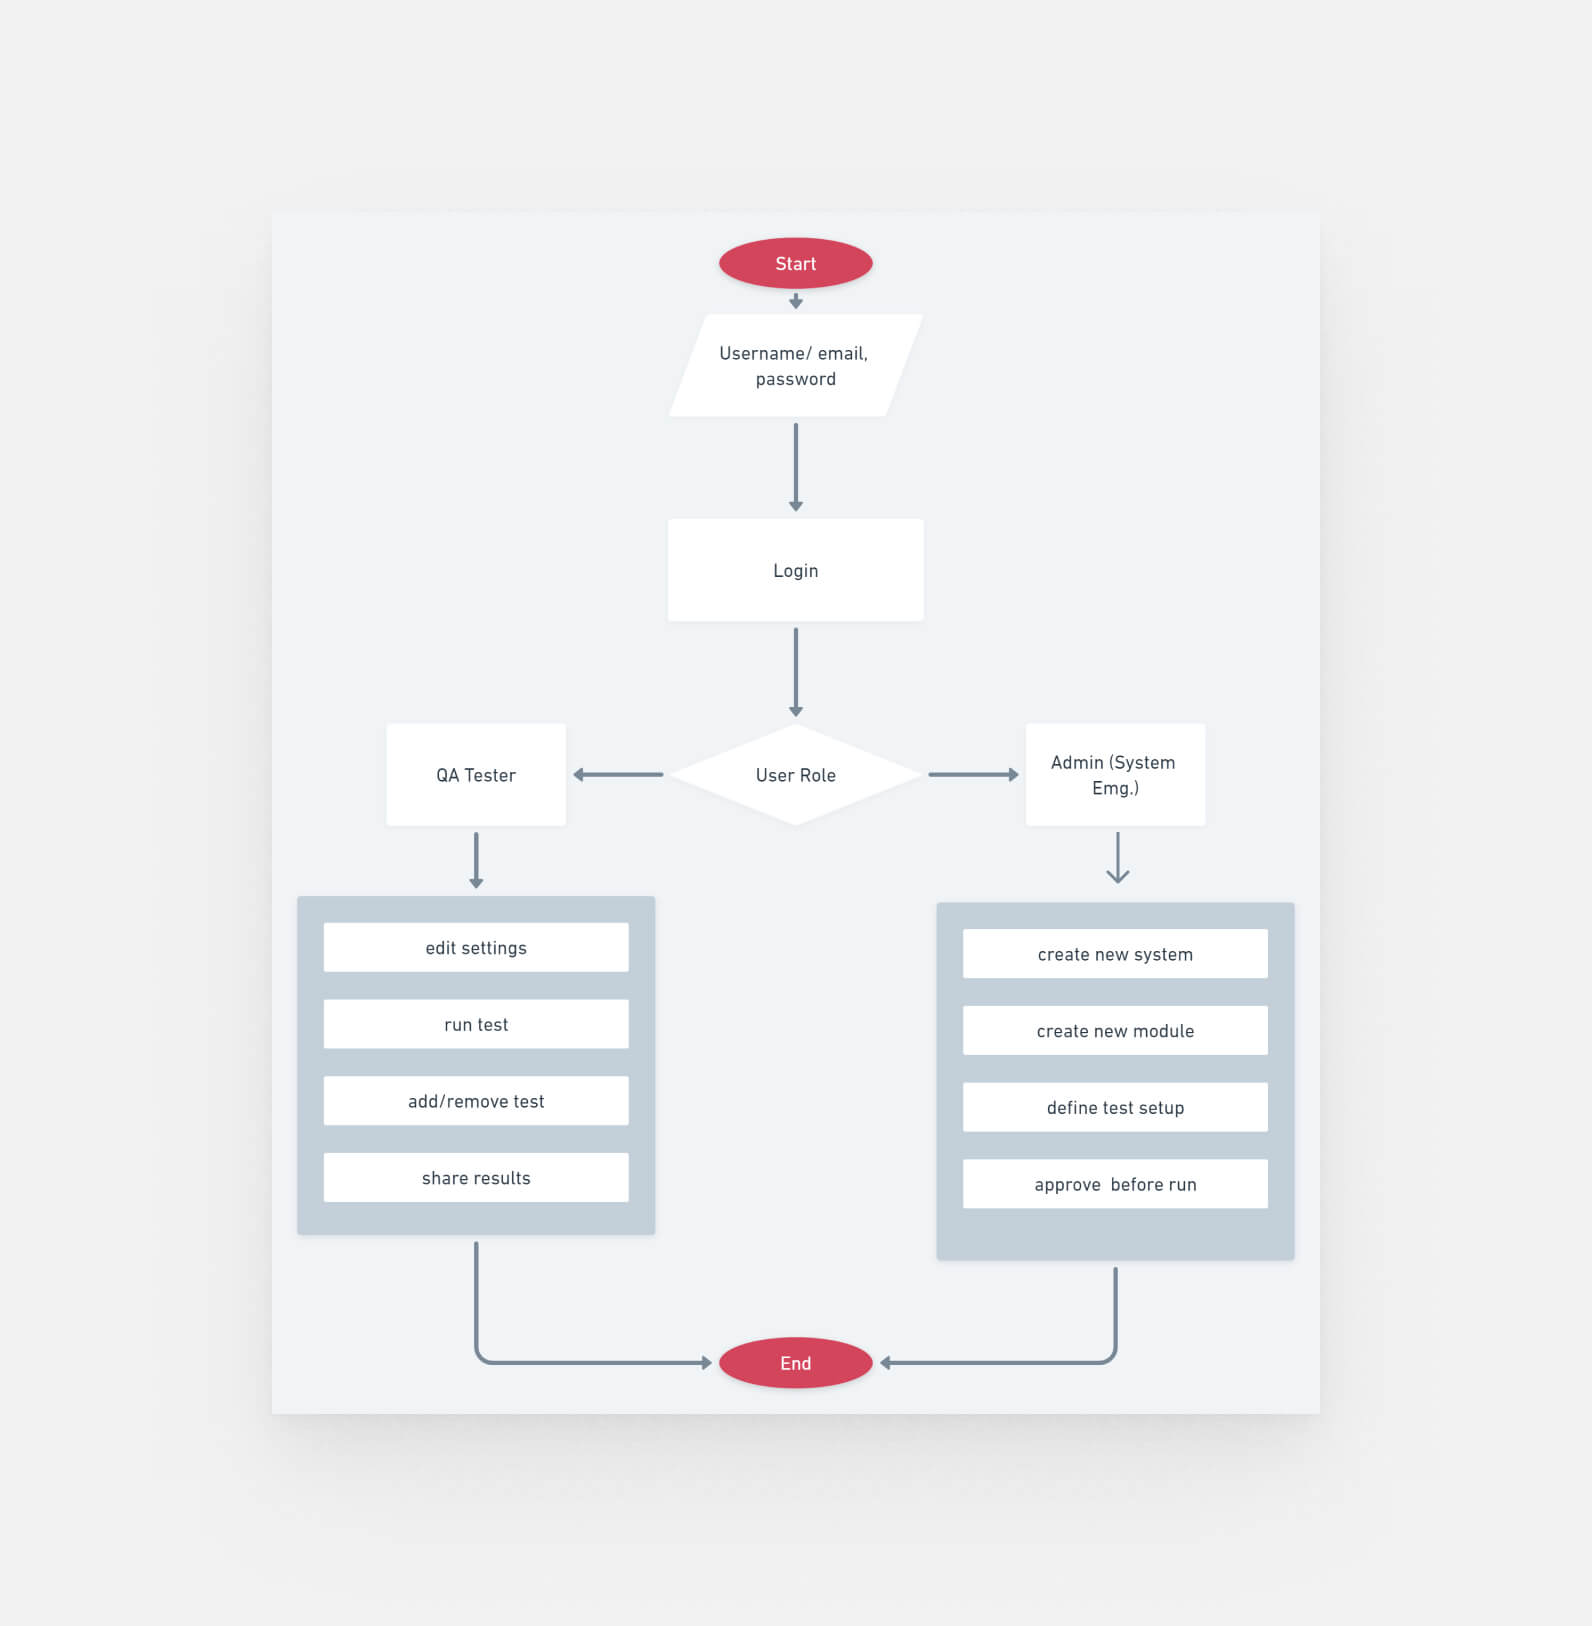
User Flow, Process Flow
Made with:
Some of the flows we analyzed
6. Wireframes
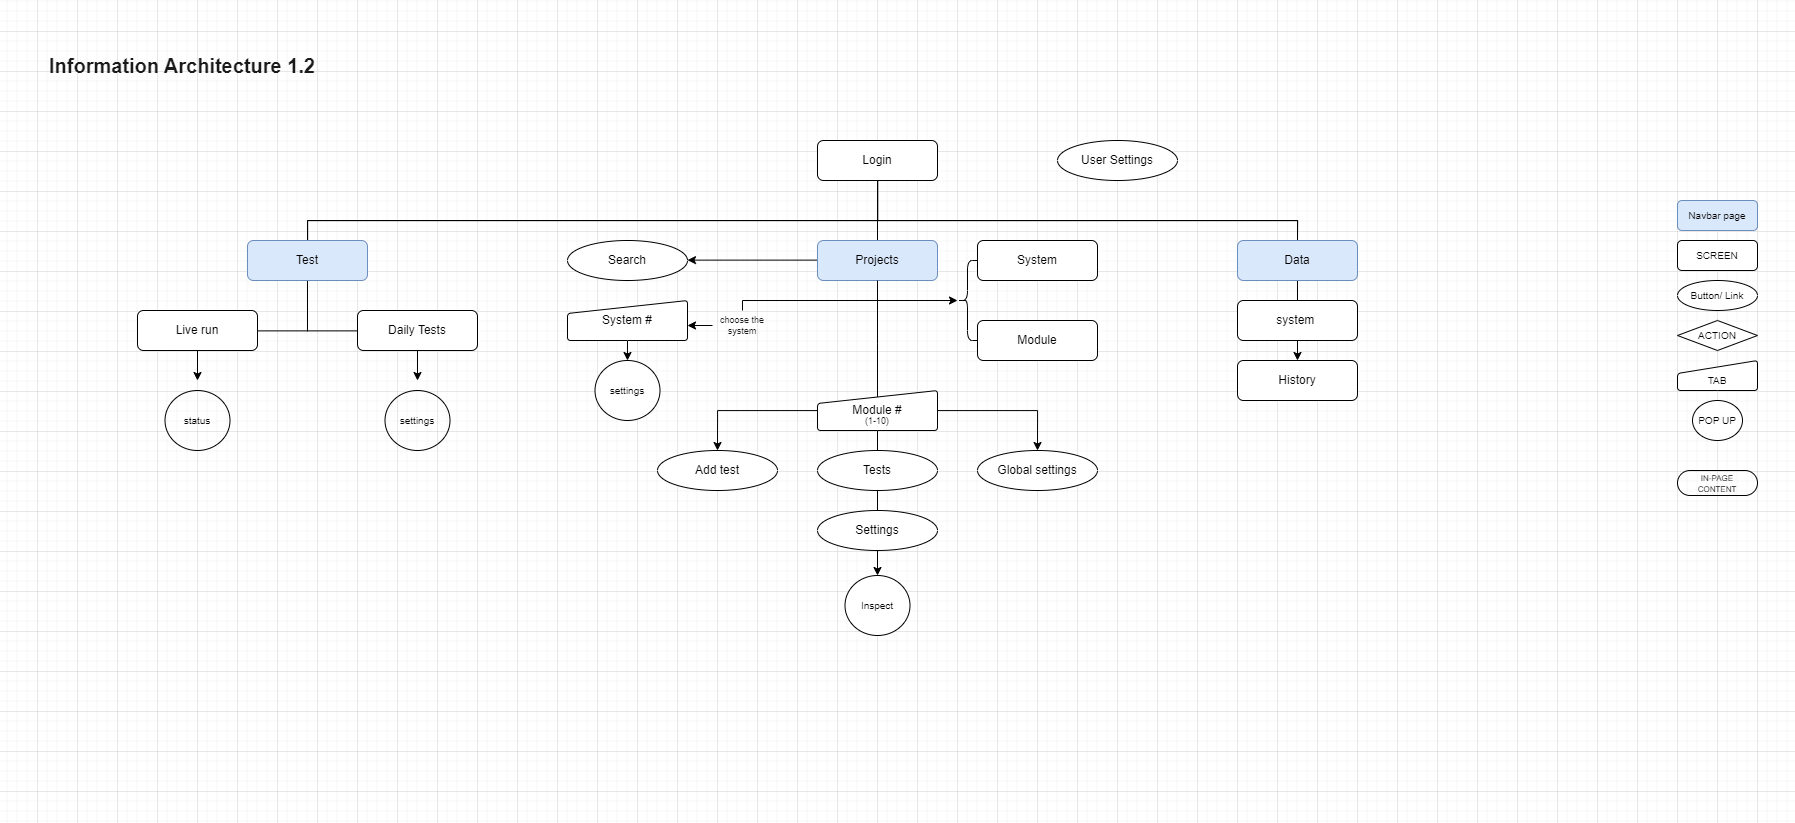
After research, I defined the system's features and created a high-level information architecture to visualize the structure and understand the relationships between functional units.
Main Pages
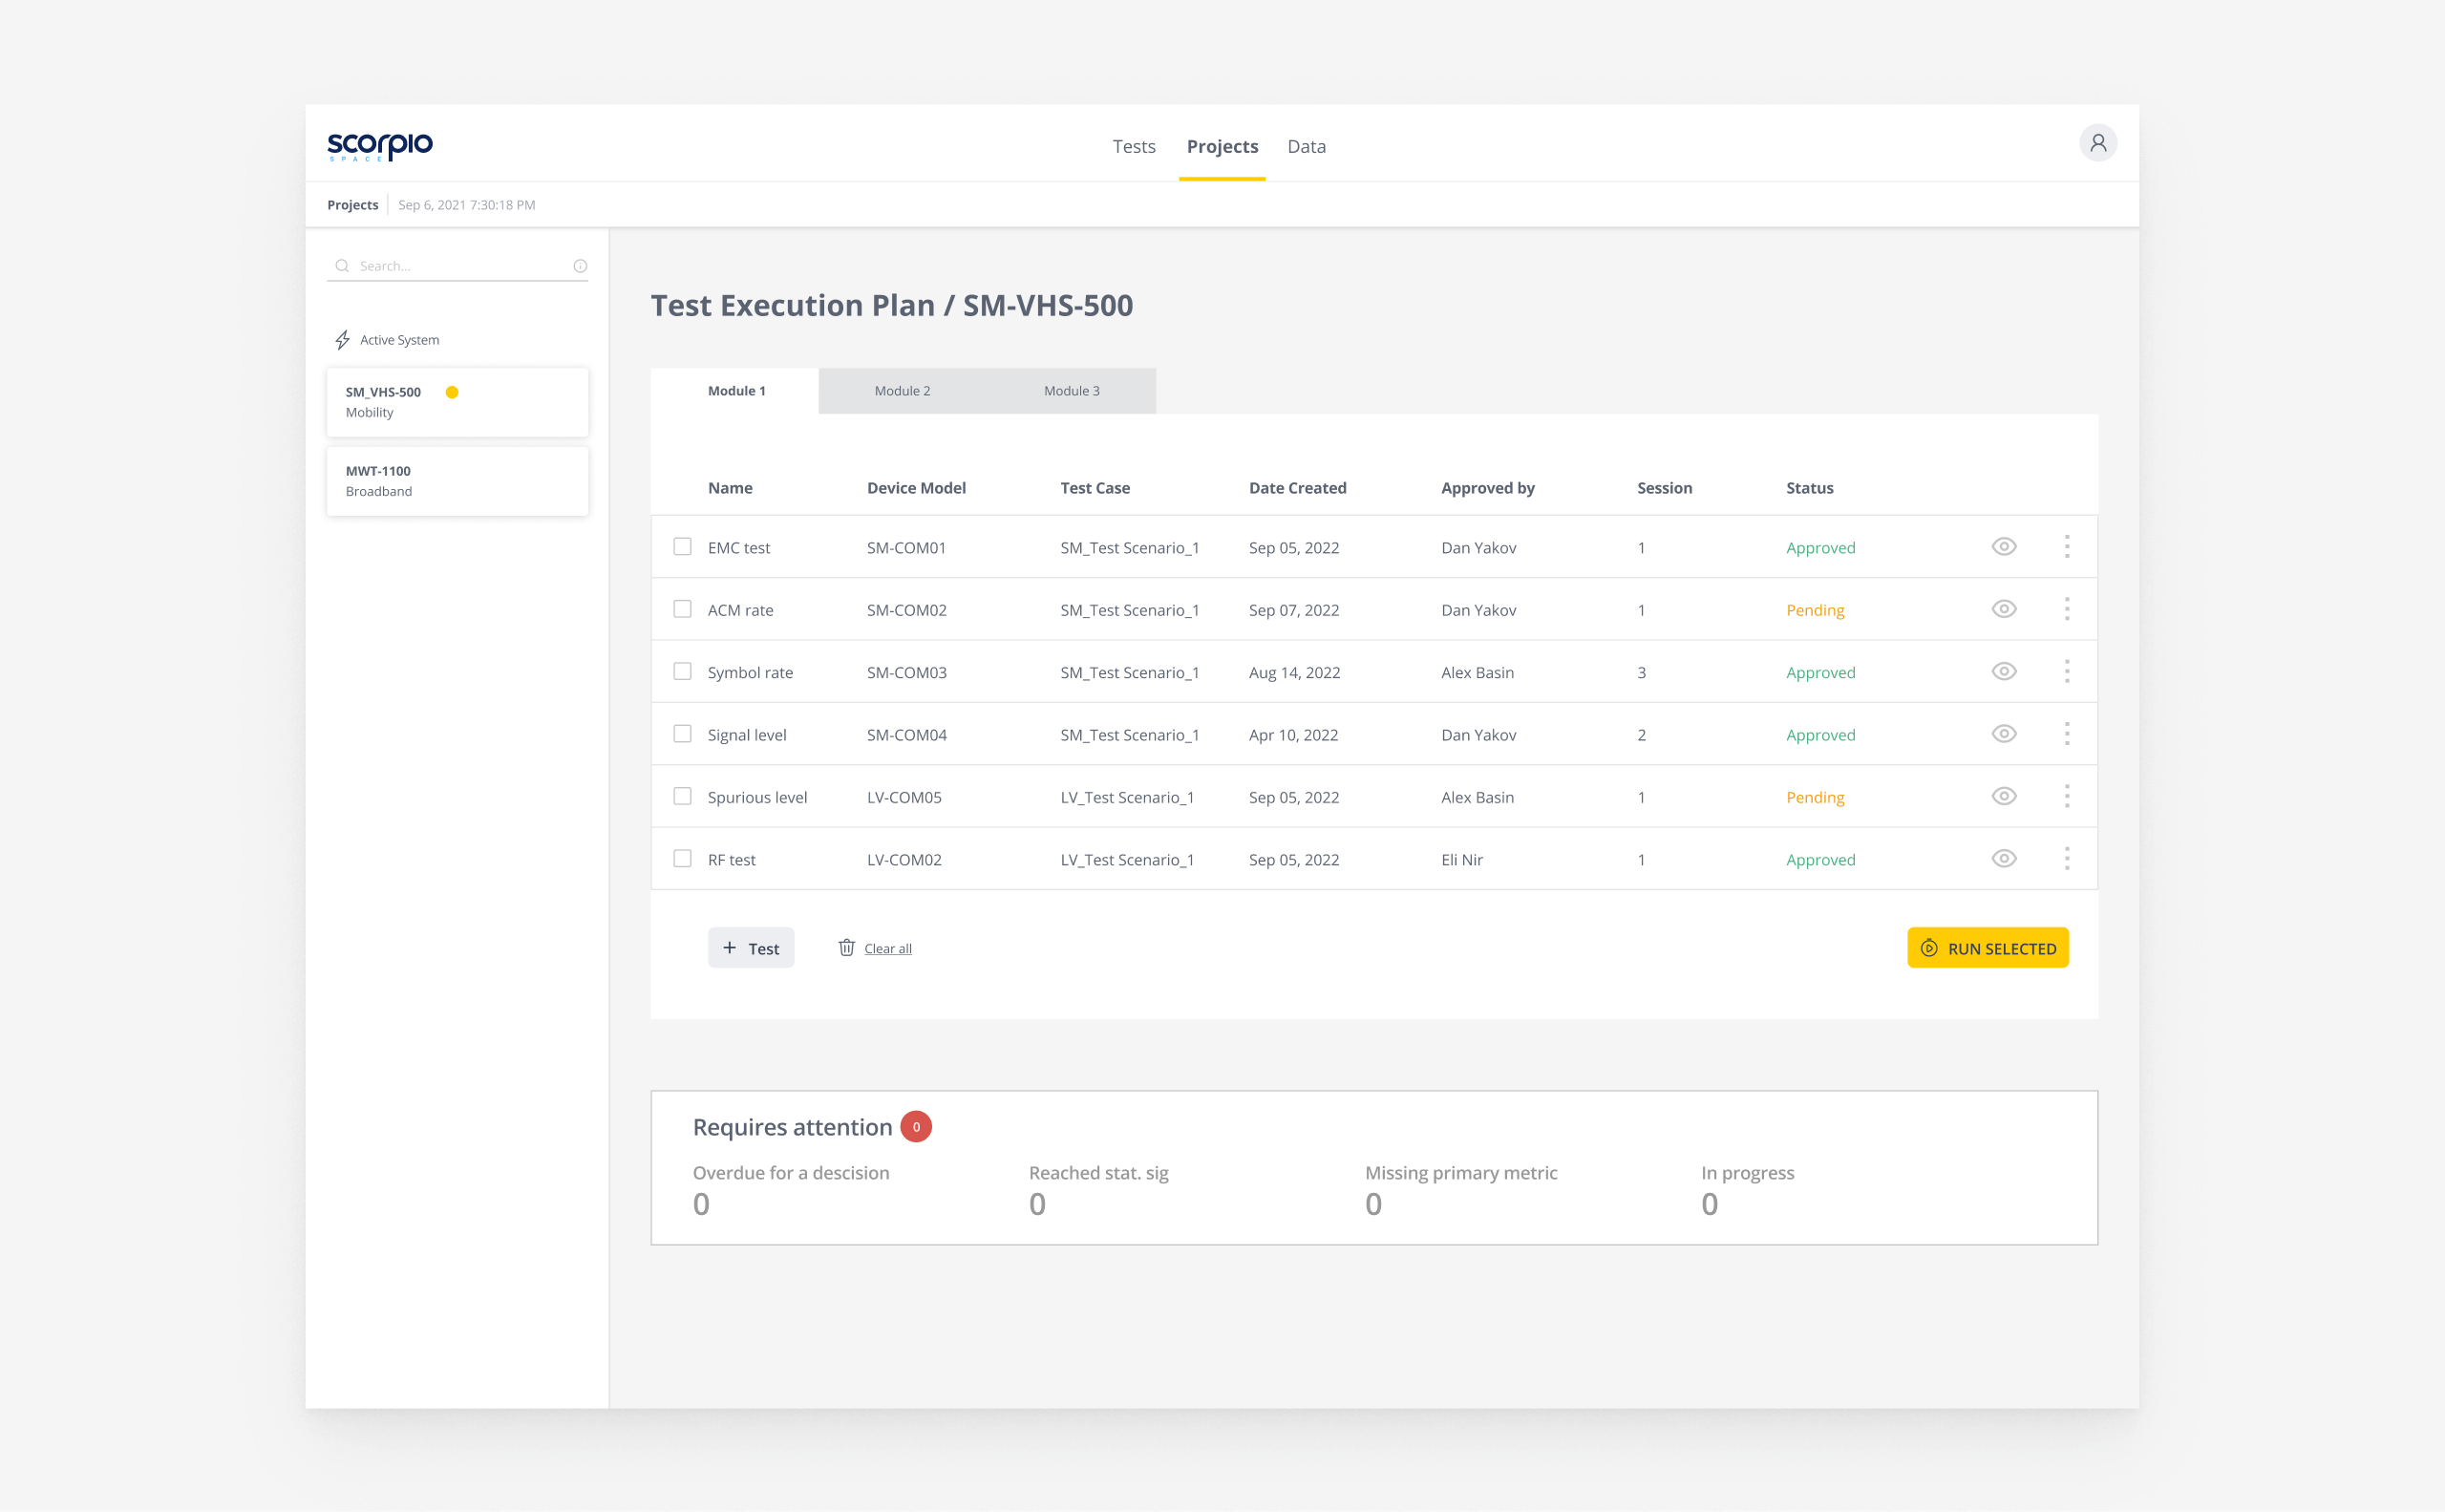
Screen- Projects
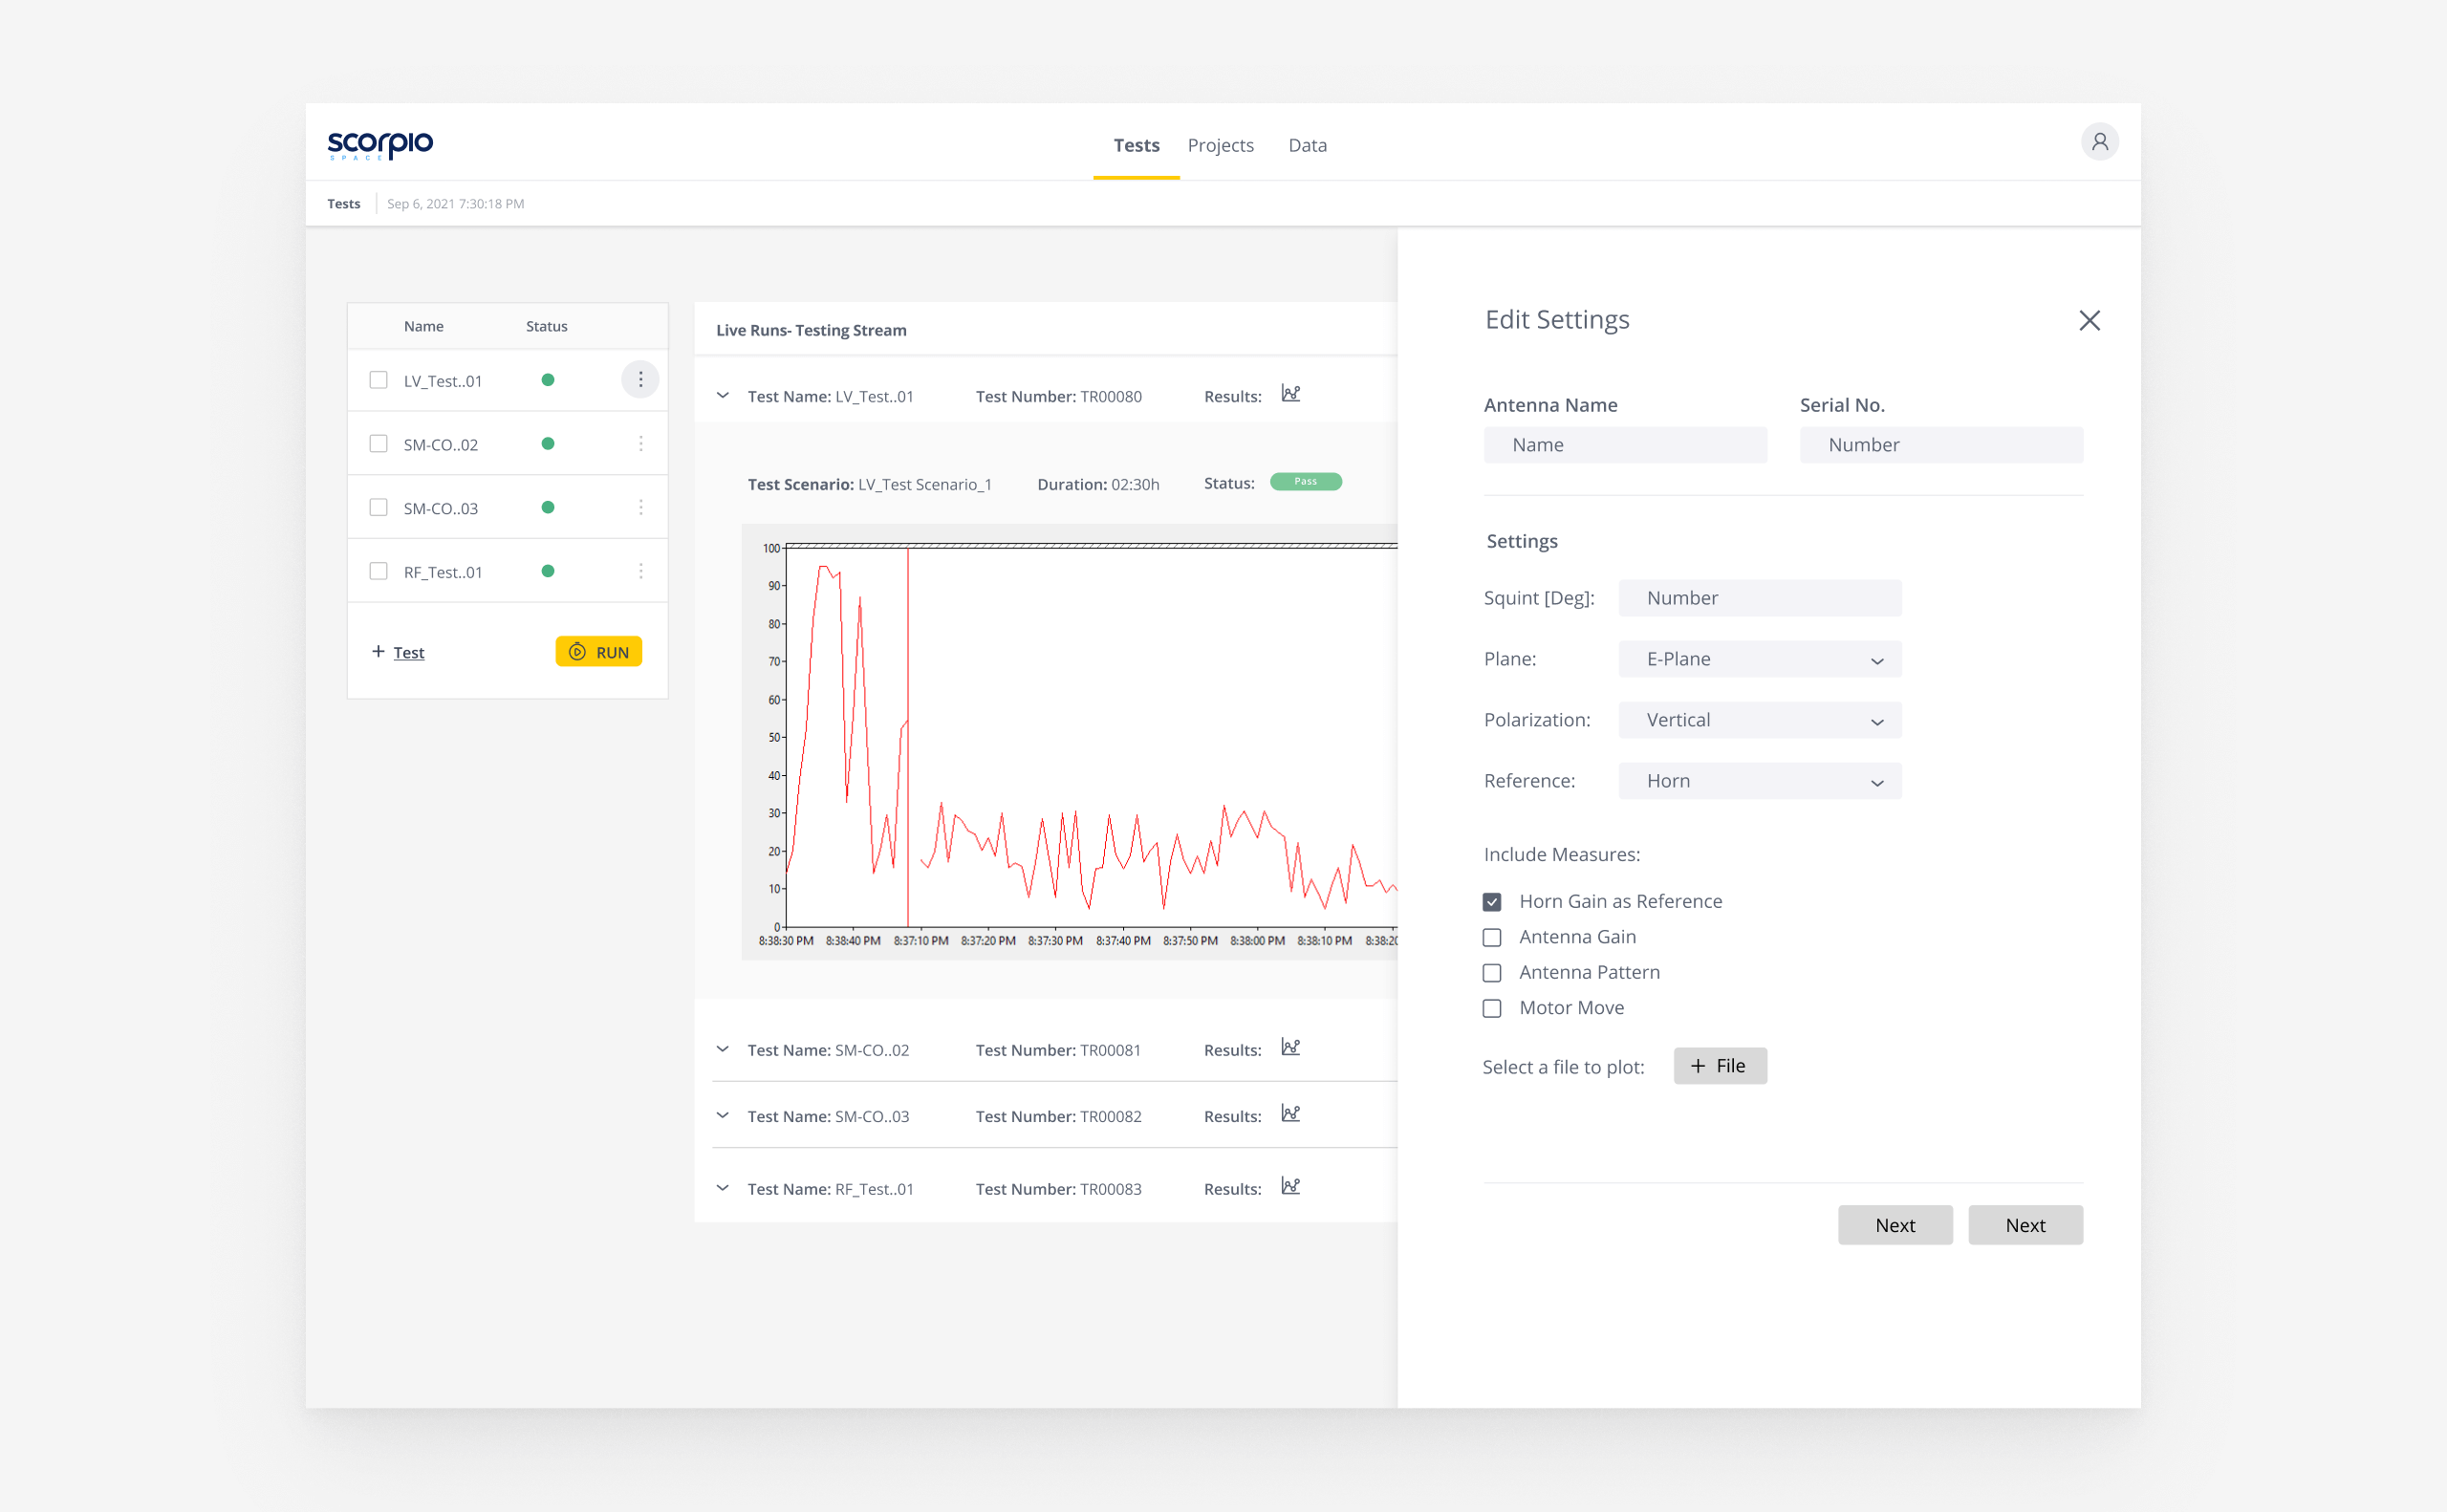
The project module is showing a test station for a specific module. On this page, the admin enters all the settings, for each test. The system will know which tests to perform according to the settings entered.
Each module that is being tested consists of a unique test setup, which defines a set of unique test procedures, each one of them is linked to a backend test script.
Screen- Tests
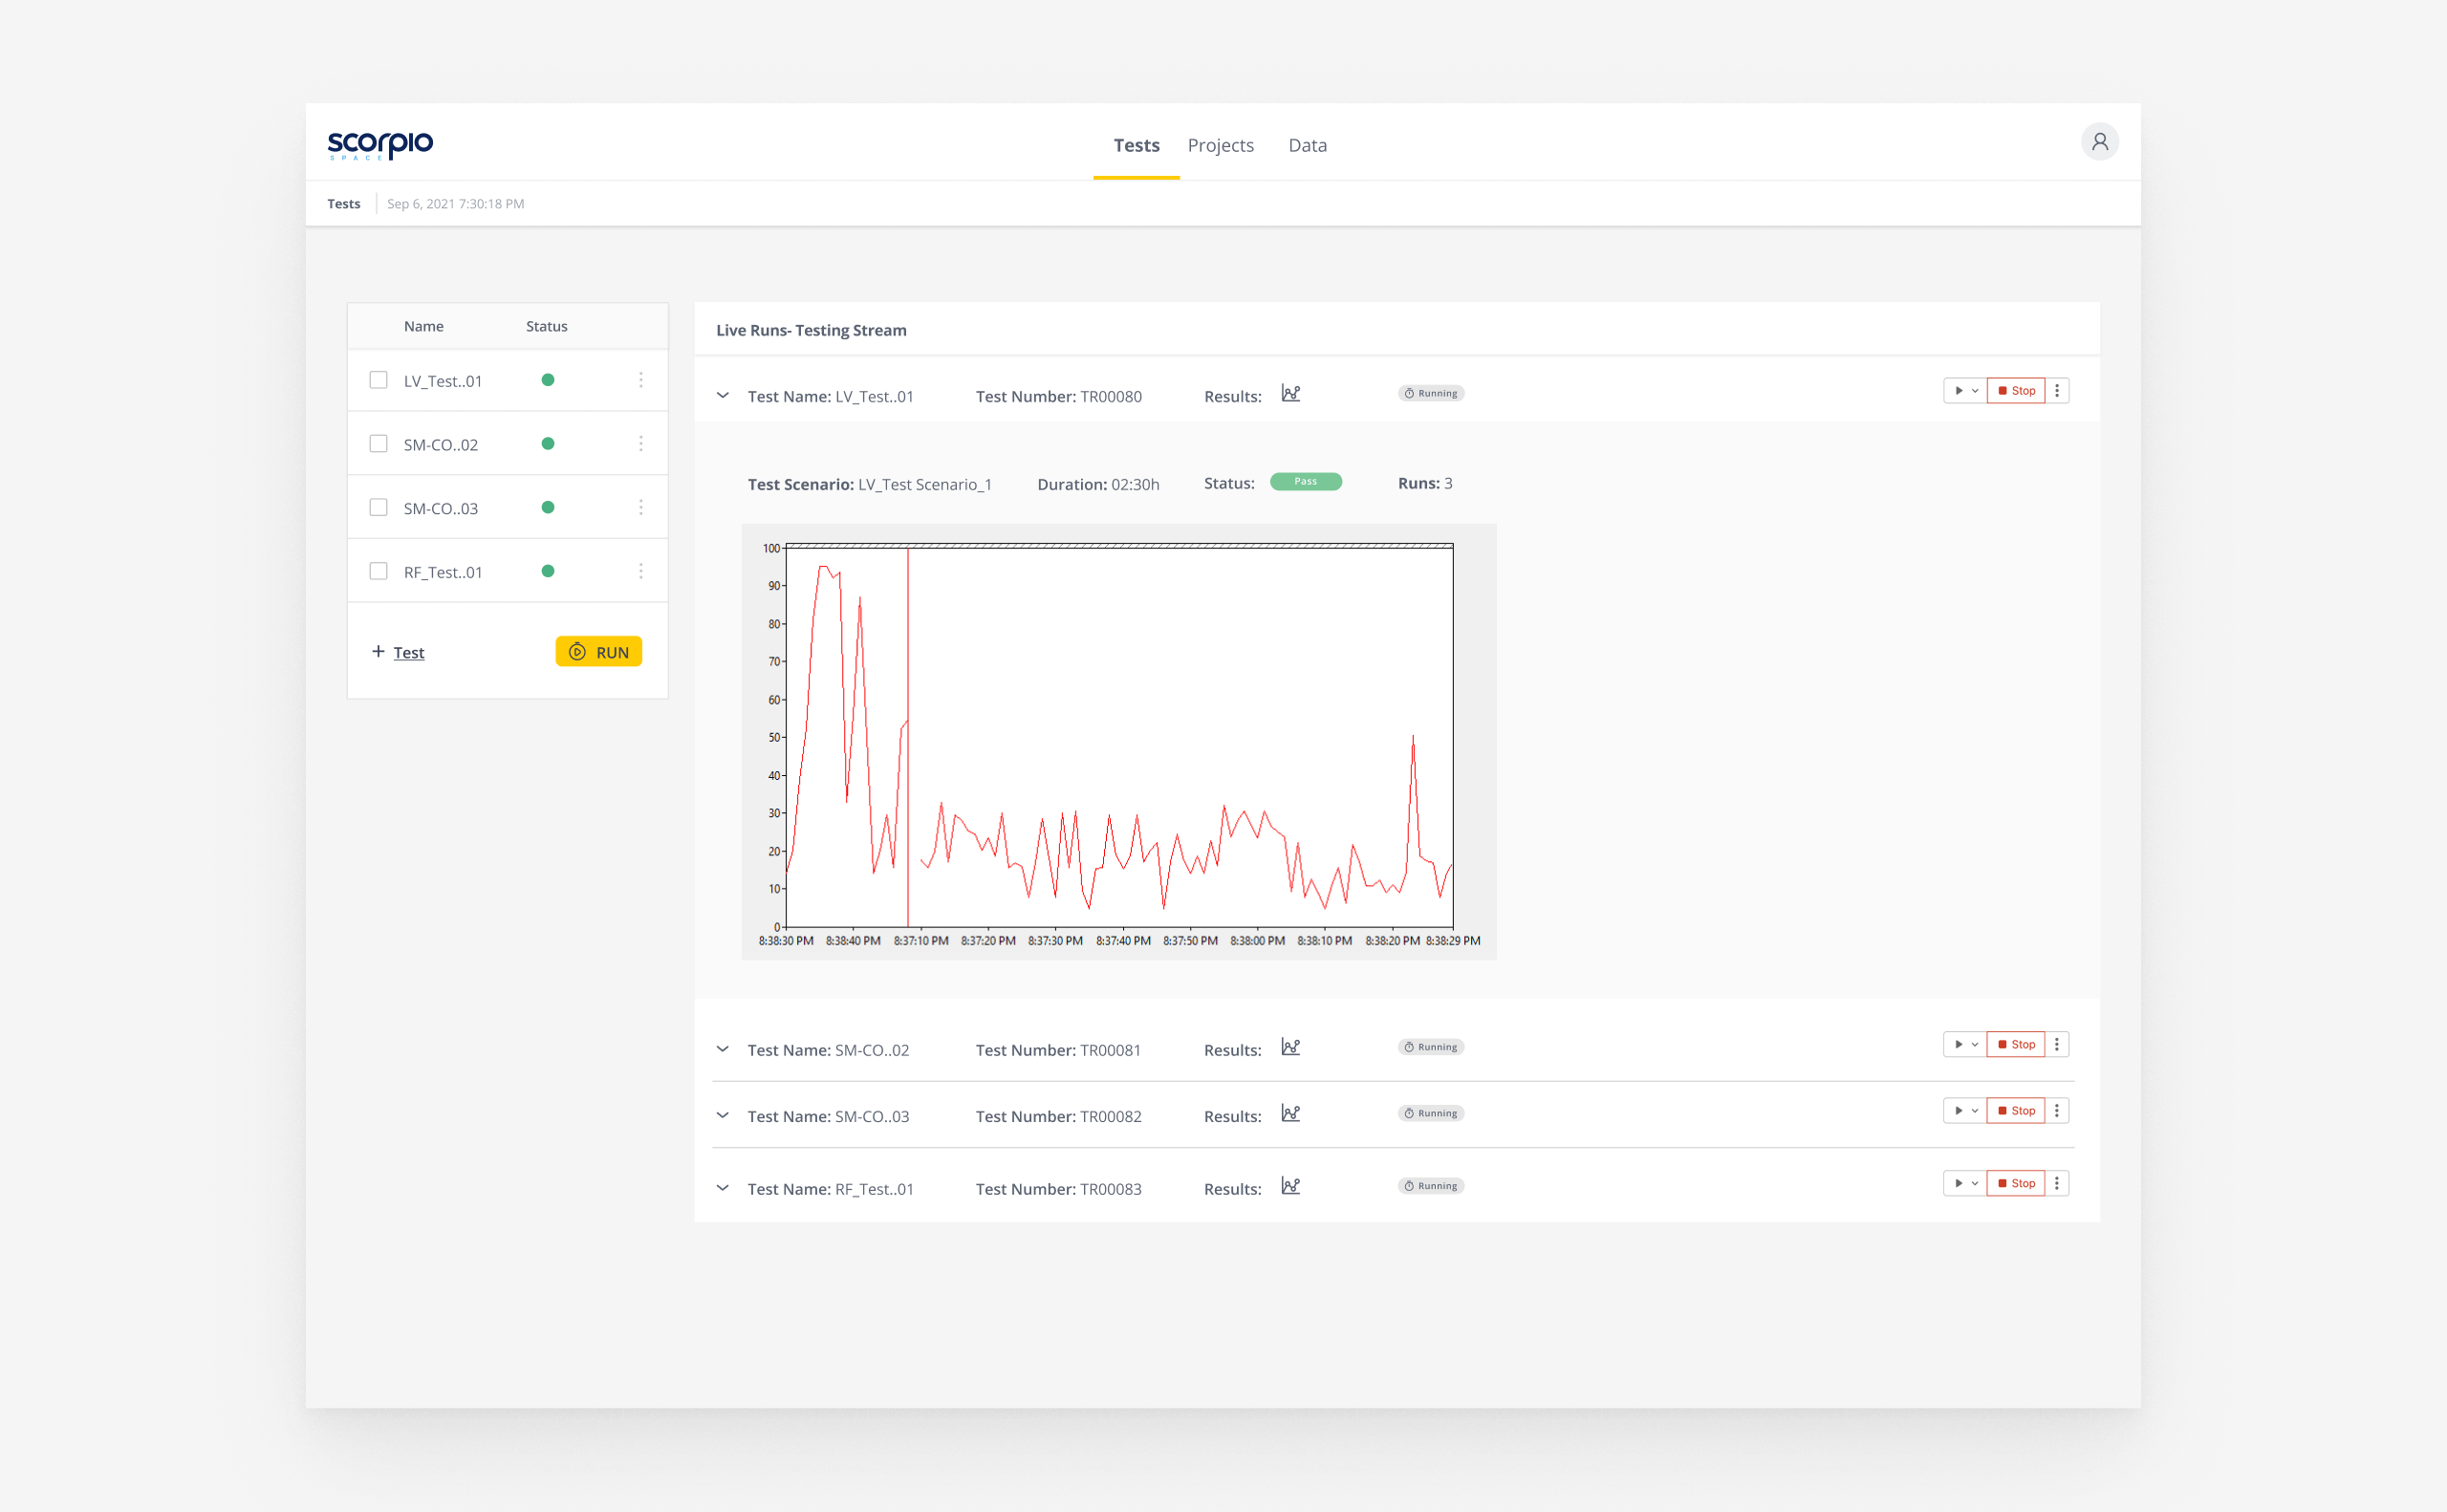
Generally, in a test station, a full test is run by a signal button click, in case of a problem the user, can stop and select a specific test procedure.
A test result can be of any type of data: a single value, a graph, a table file, or a snapshot of the current running test with its bounding limits, which are the pass/fail criteria shown in the main active window.
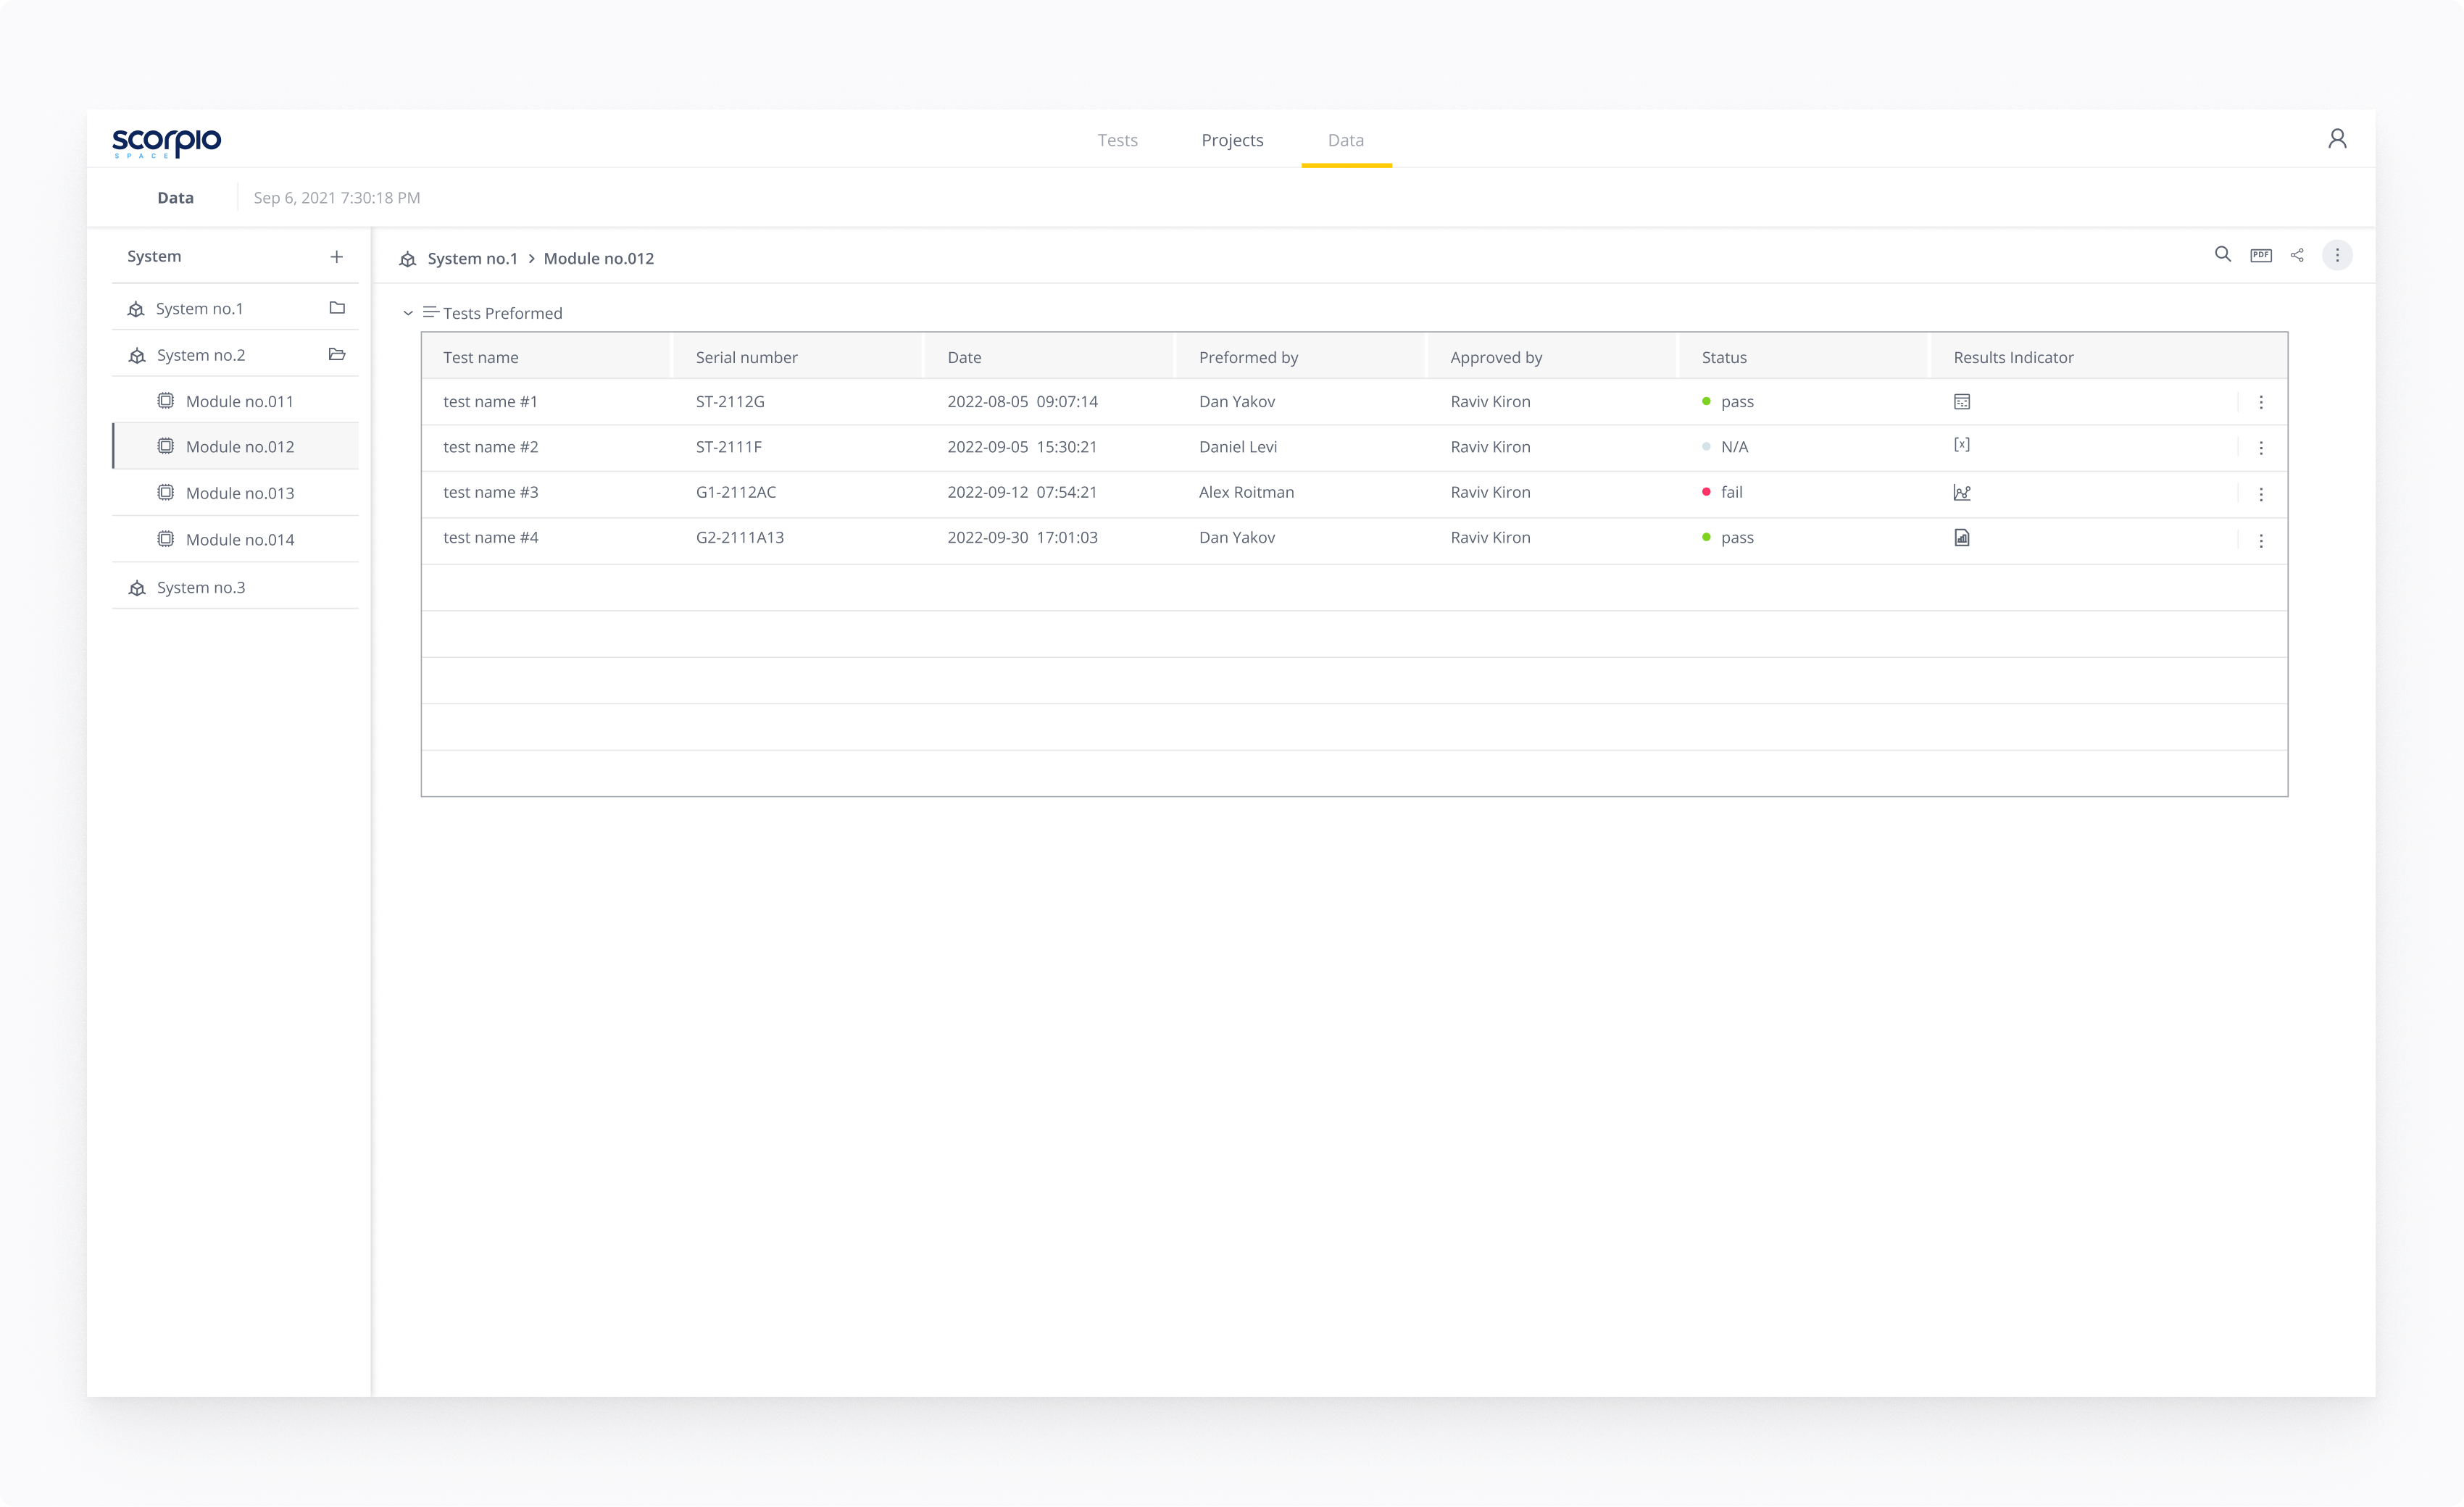
Screen- Data
The results history can be selected according to determined criteria such as date, serial numbers, etc., analyzed by statistical tools, and presented graphically or numerically.
